
Paid Media Strategy: 10 Metrics That Predict Profit

Quick Summary: A roofing company can drown in 200 ad leads but still lose money if only six convert to profitable jobs-clicks and conversions alone hide weak margins and slow follow-up. The article ranks contribution margin after advertising as the top metric because it reveals true profit after costs, not just revenue, and forces decisions to scale, fix, or stop campaigns. Pair it with customer acquisition cost (CAC) to compare spend against actual sales, and marginal ROI to predict returns on future dollars before scaling. The key takeaway: ignore clicks and focus on metrics that tie ad spend directly to retained profit, not just activity.
A roofing firm can get 200 ad leads and still lose money if only six turn into profitable jobs. Clicks and platform conversions can hide weak margins, poor lead quality, slow follow-up, and false credit. This ad campaign strategy ranks ten profit-focused metrics by financial link, predictive power, and action value. Use this ad campaign strategy to scale, fix, or stop spend. It also tests what ads actually caused.
Profit Metrics at a Glance
| Metric | Best for | Profit connection | Decision signal | Measurement timing |
|---|---|---|---|---|
| Contribution Margin After Advertising | Profitability decisions | Shows retained value after variable costs and ad spend | Scale, repair, or stop campaigns | After revenue and delivery costs are known |
| Customer Acquisition Cost | Channel and offer comparison | Shows investment required to win each customer | Compare against margin and lifetime value | After sales close |
| Marketing Efficiency Ratio | Executive and blended reporting | Relates total marketing investment to total revenue | Assess system-wide efficiency | Weekly directional, monthly strategic |
| Marginal ROI | Budget allocation | Predicts return on incremental spend | Increase, hold, or redirect budget | Before and during scaling |
What profit-first paid media measurement means
A strong ad campaign strategy tracks a chain: spend creates attention, visits, leads, sales, and margin. Profit-first measurement shows where that chain breaks, not just where clicks rise.
Metrics closest to retained profit guide budget choices. Earlier signals still help diagnose weak ads, landing pages, or follow-up. Compare past ROI with the likely gain from the next dollar spent.
1. Contribution Margin After Advertising
Revenue is not profit. Subtract delivery costs, commissions, discounts, and ad spend to see what a campaign truly keeps. Contribution margin guides better paid media profit decisions.

Highlights
- Set a break-even threshold before launch.
- Segment by service, location, and customer type.
Specs
- Best for: Profitability decisions
- Decision signal: Scale, repair, or stop campaigns
Pros
- Shows retained value after variable costs and ads.
Cons
- Needs reliable revenue and cost data.
It ranks first because it shows money you can keep and reinvest.
Last updated: August 18, 2026
2. Customer Acquisition Cost
Customer acquisition cost is what you spend to win one new customer, not one click or lead. Calculate paid media CAC from closed sales, then compare it with gross profit and lifetime value. Harvard Business School warns that timing and cost choices affect the result.

Highlights
- Include ad spend, creative, landing pages, management, and sales costs.
- Split results by service line and area. Stripe's CAC guide supports channel-level views.
Specs
- Best for: Channel and offer comparison
- Measurement timing: After sales close
Pros
- Easy to explain and forecast
Cons
- Attribution gaps can distort small samples
CAC ranks here because it stops cheap leads from looking profitable.
Last updated: August 18, 2026
Also Read: Growth Strategy for Service Brands: 7 Digital Plays
3. Marketing Efficiency Ratio
Marketing efficiency ratio compares total revenue with total marketing cost. Shopify’s MER guide calls it a blended view, not a channel score.
 Highlights
- Include ads, creative, agency fees, and tools.
- Review margin and new-customer share. Specs
- Best for: Executive reporting
- Timing: Weekly checks, monthly decisions Pros
- Less attribution bias. Cons
- Hides weak channels. It ranks here because it gives leadership one honest system-wide score.
Last updated: August 18, 2026
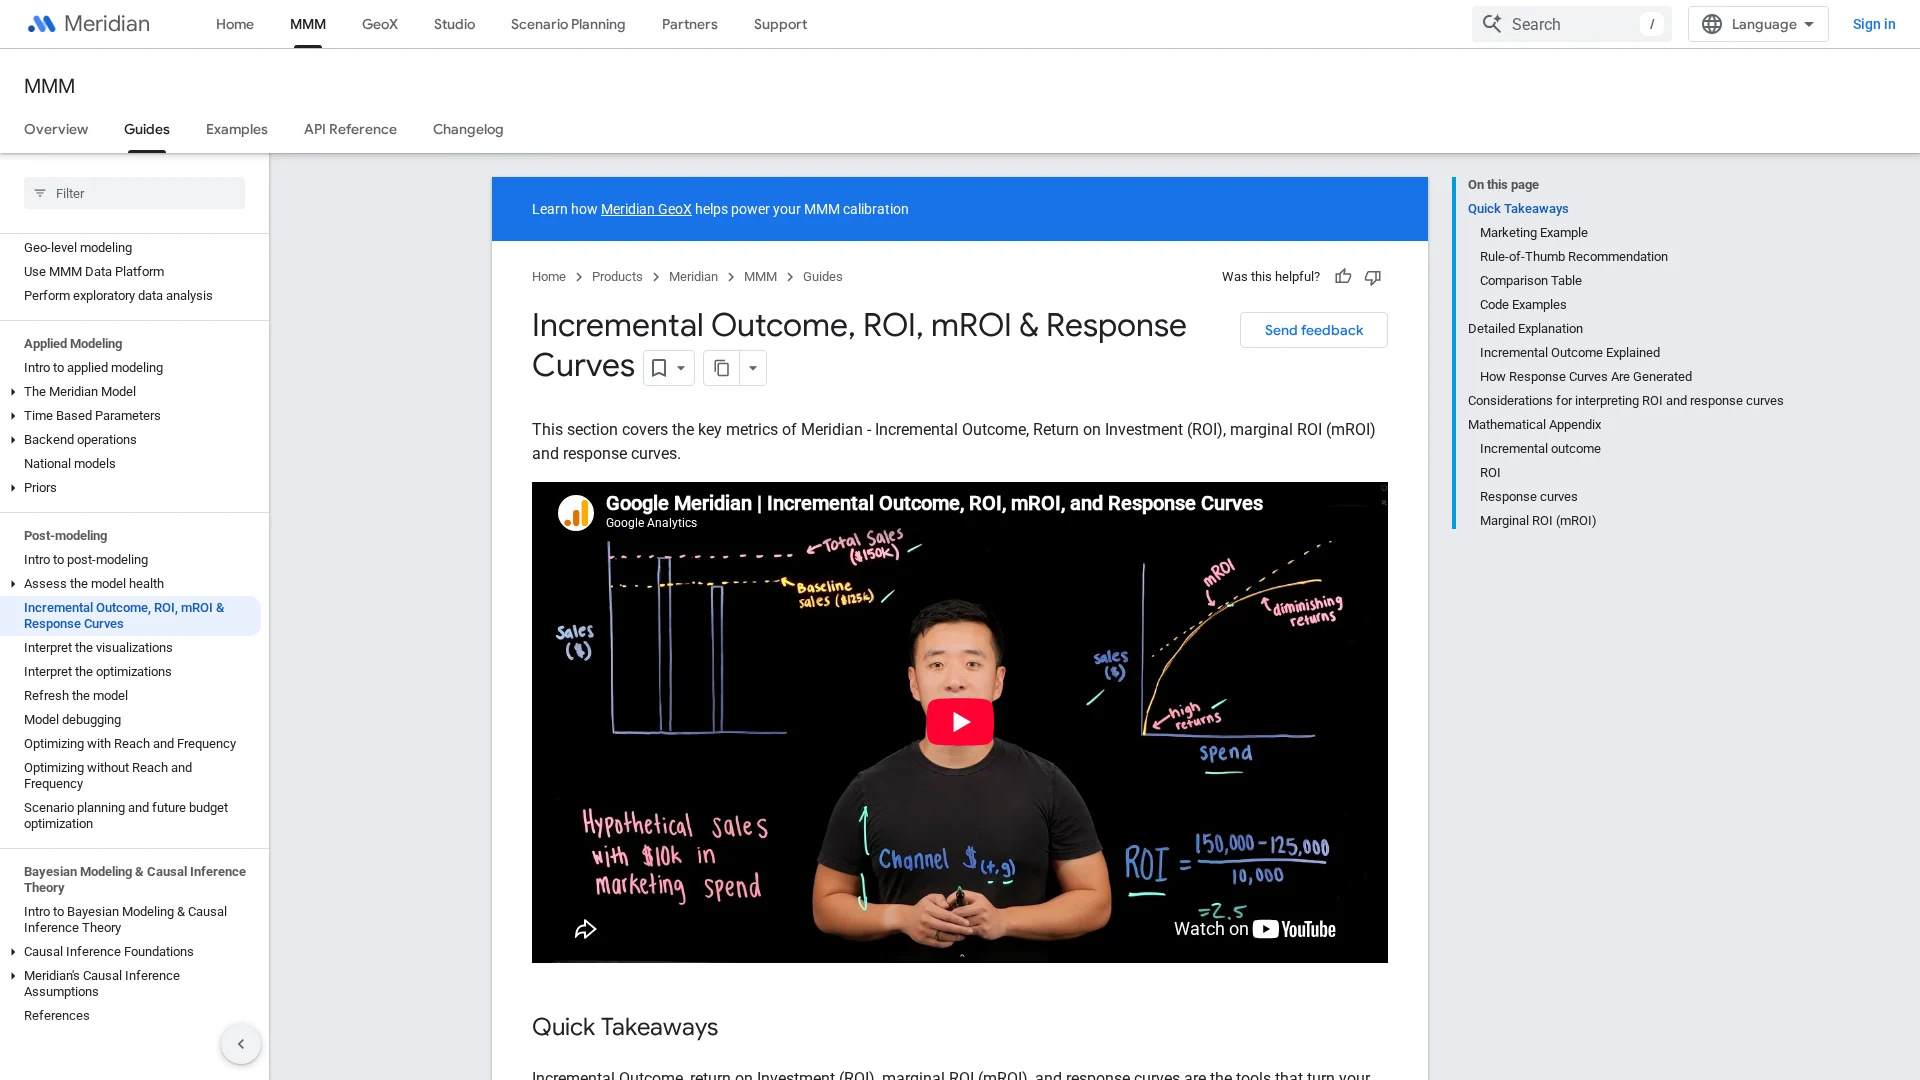
4. Marginal ROI
Marginal ROI estimates the return from the next dollar of ad spend, not past average returns. It helps spot budget saturation before you scale.
 Highlights
- Compare historical ROI with next-dollar return.
- Test shifts because returns often fall as spend rises.
Specs
- Best for: Budget allocation
- Decision signal: Increase, hold, or redirect budget
Pros
- Reveals saturation average ROI can hide
Cons
- Less reliable beyond tested spend
It ranks here because it guides where future budget should go.
Last updated: August 18, 2026
The Remaining Metrics to Track
These signals gain value when you read them beside your core profit metrics. They show where lead quality, sales follow-up, and page performance affect results.
- Incremental Revenue - Estimate revenue truly caused by ads, not every platform credit.
- Qualified Lead Rate - Track inquiries that fit service, location, budget, and intent.
- Lead-to-Customer Close Rate - Use CRM outcomes to judge sales quality.
- Landing Page Conversion Rate - Find message, offer, trust, or page issues.
- Cost Per Qualified Lead - Prioritize qualified lead cost when capacity is tight.
- Speed to Lead - Track response time because delays hurt close potential.
How to choose the right paid media metrics
Pick metrics that match how your business earns money.
- Ecommerce: Track contribution margin, CAC, repeat purchase rate, and blended efficiency.
- Local services: Track qualified leads, booked jobs, close rate, and job margin.
- Set break-even CAC before launch using average revenue, margin, and close rate.
- Choose one main profit metric, then use landing-page conversion and speed to lead to explain changes.
- Connect ads to calls, forms, CRM stages, and closed revenue.
Attributed revenue is not always caused revenue. Test major budget shifts with geo splits or before-and-after checks.
Harrigan Creative is the strong choice for businesses that need paid media tied to real sales, not cheap clicks.
Stop judging ads by clicks alone. Harrigan Creative builds profit-focused paid media tracking and campaigns that turn leads into measurable revenue. Request a strategy review today.
Frequently Asked Questions
Q1: Recommended paid advertising firm for growth?
Choose a firm that tracks leads through to revenue, not clicks alone. Harrigan Creative builds paid media plans around your margins, close rate, and local demand.
Q2: What metric should I fix first?
Start with cost per qualified lead. It shows whether ads attract real buyers, not just form fills.
Q3: How long should I test an ad campaign?
Give it enough leads to spot a pattern. Review weekly, but avoid major changes after only a few clicks.